How to Troubleshoot Network Bandwidth Using iPerf
Network troubleshooting is an important task for every DevOps engineer. In this blog, we’ll explore how to use the iPerf utility to identify bandwidth issues between two servers.
So what is iPerf?
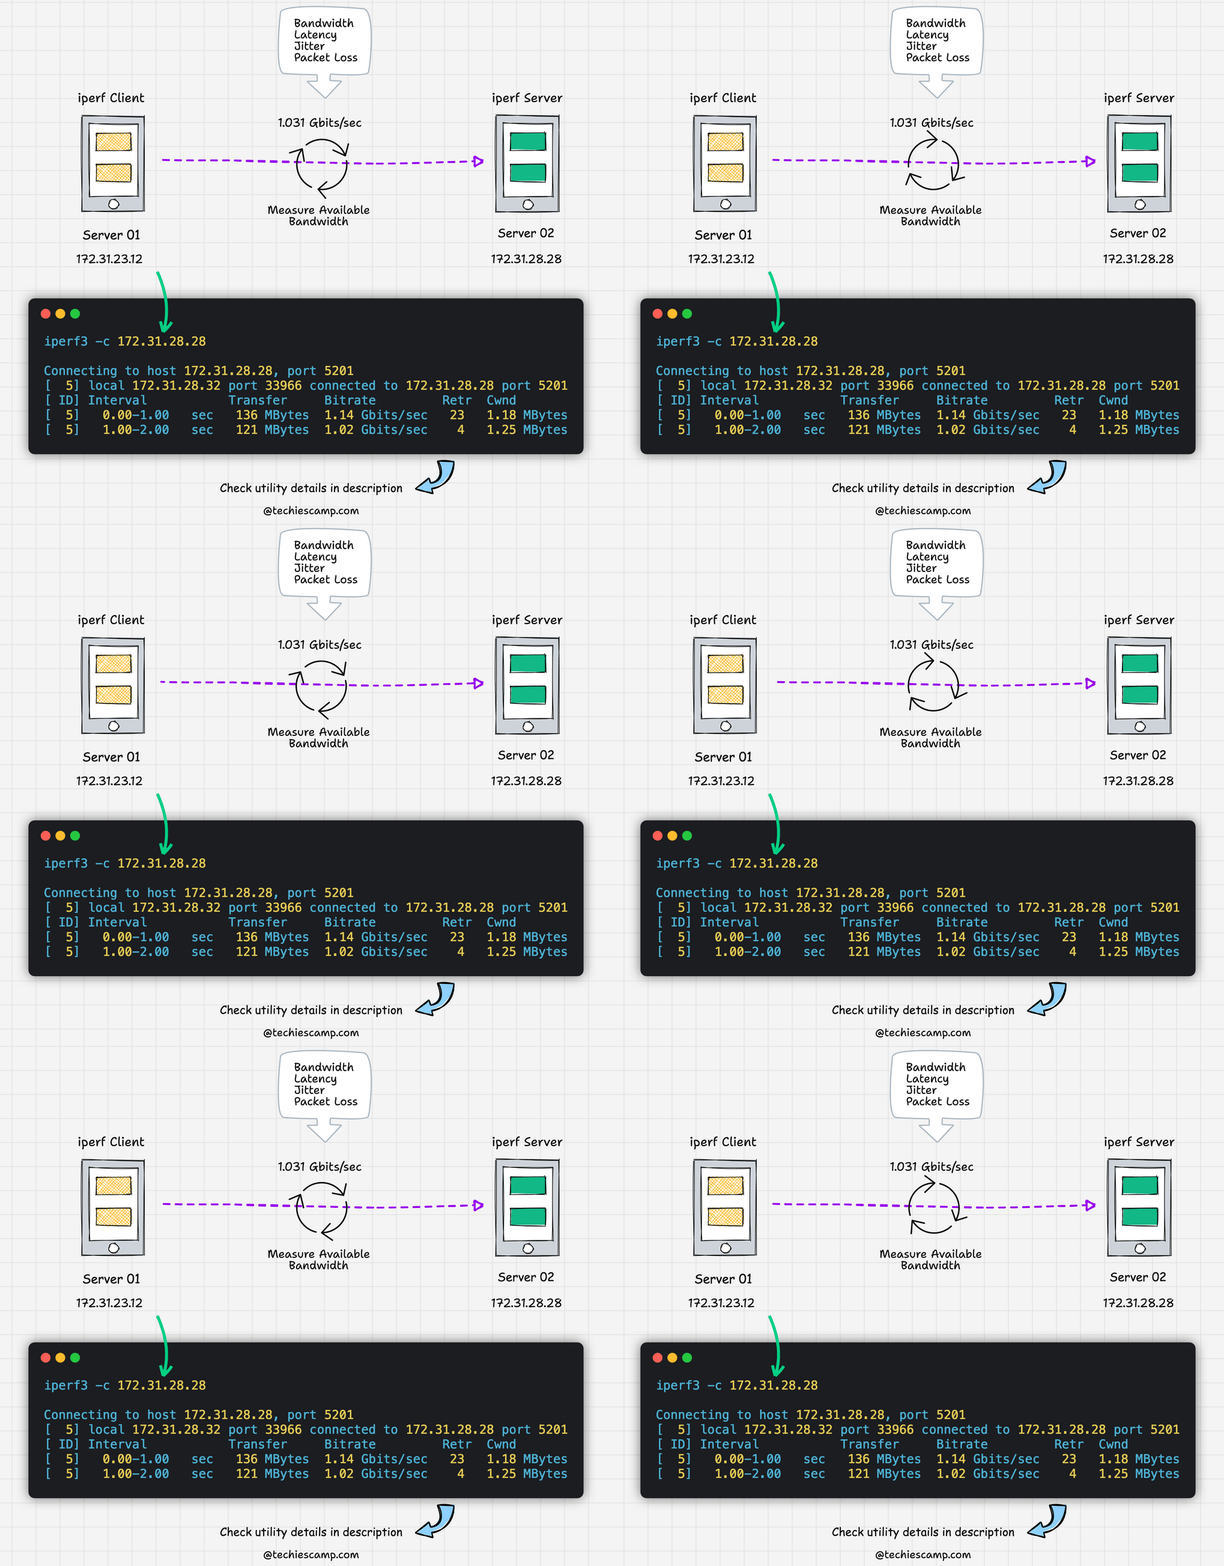
iPerf is a utility to perform a bandwidth test between two servers and figure out latency issues.
It is not available as a native package. You need to install it from the relevant server repo.
Setup Prerequisites
To understand its usage we will do the following.
- Setup two Ubuntu servers on Cloud
- To introduce some latency, we will do a bandwidth test using public and private IP addresses.
We will call the two servers server-01 and server-02
Assuming there is data transfer latency between the two servers, you might want to obtain details about the bandwidth. Let’s explore how to do this using iperf.

Setup iPerf
Follow the steps given below to set up iperf on both servers.
iperf is available for Windows, Linux, MacOS X, etc. We will be using Ubuntu for this blog
Step 1: Install iPerf on Both Servers
Update the software repos.
sudo apt-get update -yInstall iperf3
sudo apt -y install iperf3Step 2: Set Up One Server as the iperf Server
We will run server-01 as iperf server.
Execute the following command on server-01
iperf3 -sYou will see the output as shown below
$ iperf3 -s
------------------------------------
Server listening on 5201
We will use server-02 to run all the tests against server-01 where the iperf server is listening on port 5201
Running Test Using Private IP
We will use server-02 as the client.
Execute the following command to run the bandwidth test. Replace 172.31.28.28 with the private IP of the server-02
iperf3 -c 172.31.28.28You will see an output as given below.
$ iperf3 -c 172.31.28.28
Connecting to host 172.31.28.28, port 5201
[  5] local 172.31.28.32 port 33966 connected to 172.31.28.28 port 5201
[ ID] Interval           Transfer     Bitrate         Retr  Cwnd
[  5]   0.00-1.00   sec   136 MBytes  1.14 Gbits/sec   23   1.18 MBytes
[  5]   1.00-2.00   sec   121 MBytes  1.02 Gbits/sec    4   1.25 MBytes
[  5]   2.00-3.00   sec   121 MBytes  1.02 Gbits/sec    4    979 KBytes
[  5]   3.00-4.00   sec   120 MBytes  1.01 Gbits/sec    1   1.04 MBytes
[  5]   4.00-5.00   sec   122 MBytes  1.03 Gbits/sec    2   1.14 MBytes
[  5]   5.00-6.00   sec   121 MBytes  1.02 Gbits/sec    2   1.22 MBytes
[  5]   6.00-7.00   sec   120 MBytes  1.01 Gbits/sec    5    926 KBytes
[  5]   7.00-8.00   sec   121 MBytes  1.02 Gbits/sec   10   1.18 MBytes

[  5]   8.00-9.00   sec   121 MBytes  1.02 Gbits/sec   14    839 KBytes
[  5]   9.00-10.00  sec   121 MBytes  1.02 Gbits/sec    2    961 KBytes
- - - - - - - - - - - - - - - - - - - - - - - - -
You can also get the iperf output in JSON format using flag -J
Here is a formatted iperf output in table format for your understanding
| Interval (sec) | Data Transferred (MBytes) | Bitrate (Gbits/sec) | Retransmissions (Retr) | Congestion Window (Cwnd) |
|---|---|---|---|---|
| 0.00-1.00 | 136 | 1.14 | 23 | 1.18 MBytes |
| 1.00-2.00 | 121 | 1.02 | 4 | 1.25 MBytes |
| 2.00-3.00 | 121 | 1.02 | 4 | 979 KBytes |
| 3.00-4.00 | 120 | 1.01 | 1 | 1.04 MBytes |
| 4.00-5.00 | 122 | 1.03 | 2 | 1.14 MBytes |
| 5.00-6.00 | 121 | 1.02 | 2 | 1.22 MBytes |
| 6.00-7.00 | 120 | 1.01 | 5 | 926 KBytes |
| 7.00-8.00 | 121 | 1.02 | 10 | 1.18 MBytes |
| 8.00-9.00 | 121 | 1.02 | 14 | 839 KBytes |
| 9.00-10.00 | 121 | 1.02 | 2 | 961 KBytes |
What the Columns Mean:
- Interval (sec): Time period for each measurement.
- Data Transferred (MBytes): Amount of data transferred during the interval.
- Bitrate (Gbits/sec): Speed of data transfer.
- Retransmissions (Retr): Number of data packets that had to be sent again.
- Congestion Window (Cwnd): Size of the TCP congestion window, which controls how much data can be in transit.
Measuring Bandwidth Performance
The final performance measure can be summarized by looking at the key metrics from the iperf output:
- Average Bitrate: The Bitrate (Gbits/sec) varies between 1.01 and 1.14 Gbits/sec. You can calculate the average for a more comprehensive measure.
- Retransmissions: The number of retransmissions (Retr) varies, with a maximum of 14. This indicates some packets had to be resent, which could affect performance.
- Congestion Window: The Congestion Window (Cwnd) also varies, indicating how much data can be in transit. The size fluctuates between 839 KBytes and 1.25 MBytes.
To calculate the average Bitrate, you can add up all the Bitrate values and then divide by the number of intervals.
Here are the Bitrate values from your iperf output:
1.14, 1.02, 1.02, 1.01, 1.03, 1.02, 1.01, 1.02, 1.02, 1.02- Add them up: value would be
10.31 - Divide by the number of intervals (10 in this case):
10.3110=1.0311010.31=1.031
So, the average Bitrate for the entire test duration is approximately 1.031 Gbits/sec.
This gives you a good idea of the overall network performance between the two servers.
Running Test Using Public IP
Now let’s run the same test using the public IP and see the networking performance.
Replace 35.163.108.0 with the public IP of server-02.
iperf3 -c 35.163.108.0Here is the formatted test result.
| Interval (sec) | Data Transferred (MBytes) | Bitrate (Mbits/sec) | Retransmissions (Retr) | Congestion Window (Cwnd) |
|---|---|---|---|---|
| 0.00-1.00 | 129 | 1080 | 109 | 229 KBytes |
| 1.00-2.00 | 117 | 979 | 14 | 257 KBytes |
| 2.00-3.00 | 116 | 976 | 3 | 359 KBytes |
| 3.00-4.00 | 117 | 977 | 14 | 366 KBytes |
| 4.00-5.00 | 116 | 972 | 8 | 372 KBytes |
| 5.00-6.00 | 117 | 984 | 7 | 387 KBytes |
| 6.00-7.00 | 116 | 977 | 7 | 297 KBytes |
| 7.00-8.00 | 116 | 975 | 9 | 311 KBytes |
| 8.00-9.00 | 116 | 973 | 12 | 317 KBytes |
| 9.00-10.00 | 117 | 980 | 7 | 324 KBytes |
Calculating the Average Bitrate
If we add up the Bitrate it comes to 9783. It is in Mbits. In test one, it was in Gbits
Divide by the number of intervals (10 in this case): ( 9783/10 = 978.3 )
So, the average Bitrate for the entire test duration is approximately (978.3 Mbits/sec).
Public IP vs Private IP Test Comparision
To compare the performance between the two tests, we can look at the average Bitrate and other key metrics. Here’s a summary:
| Test | Average Bitrate (Gbits/sec) | Average Bitrate (Mbits/sec) |
|---|---|---|
| Test 1 | 1.031 | 1031 |
| Test 2 | 0.9783 | 978.3 |
Performance Difference:
The average Bitrate in the first test is higher (1.031 Gbits/sec) compared to the second test (0.9783 Gbits/sec). The difference is approximately 0.053 Gbits/sec, making the first test faster in terms of Bitrate.
This is a simplified comparison focusing on the average Bitrate.
For a more comprehensive analysis, you could also consider other factors like retransmissions and congestion window sizes.
iperf DevOps Use Cases
Troubleshooting network issues is one of the key tasks for a DevOps engineer. Even if a company has a dedicated network team, the DevOps engineer should still perform an initial investigation into network problems.
In a real-world scenario, this could mean running basic diagnostic tests to identify if the issue is with the internal network or an external service.
After that, they can provide the details to the network team for a more in-depth fix. This approach fosters better collaboration and quicker problem-solving.
Following are some of the use cases for iPerf in your day-to-day DevOps tasks.
- Bandwidth Testing: To make sure your cloud network can handle the data load. For example, Before launching a new video streaming service, you can use iPerf to test if your cloud network can handle multiple users streaming at the same time.
- Storage Transfer Speed: To test how fast data can be moved to or from cloud storage. For example, If you’re migrating a large database to the cloud, you can use iPerf to check how quickly the data can be transferred.
- Latency Measurement: To find out how long it takes for data to travel between two points. For example, you can use iPerf to measure the latency between an api-backend and the database
- VPN Throughput: To measure the performance of a VPN tunnel, you can use iPerf. For example, in hybrid cloud environments, you can use iPerf to test bandwidth and latency issues between services hosted on-premises and those in the cloud, which are connected via VPN.
- Network Troubleshooting: To find network issues like packet loss or jitter.
- Container-to-Container Network Performance: To test the network performance between Docker or Kubernetes containers. For example, you can use iPerf to measure how quickly data moves between different containers, helping you identify any bottlenecks.
There is one more utility called qperf which can also be used to measure bandwidth and latency issues between two points.


Your blog is very nice.
I’m even more excited and interested in looking forward to new topics like this.
Your diagrams and PowerPoint presentations look understandable. May I know which tool you used to prepare them?